Harjot Kaur

Experienced Product Manager and Data Science professional, adept at building Product/Program Strategy with Business Analytics & Insights while managing customer experience, pricing & revenue management across varied marketing (B2C & B2B) functions.
Apart from work, I am invested in running marathons, climbing mountains and reading!
View My LinkedIn Profile | View My GitHub Profile
Electricity Load and Price Forecasting for Short Term Period
Time Series Forecasting
The notebook was built using GitHub
Project Abstract: Electricity trading has grown with superlative rapidity. It is a special form of commodity as it cannot be stored, and electricity price is too volatile. The cost of over-contracting or under-contracting and then buying or selling electricity is so high that it can even lead to bankruptcy. This project aims to make a high-frequency short-range price forecast to take electricity trading decisions at asset as well as macro-level for the deregulated Alberta Canada market.
Using an accurate price forecast, energy supply companies would be able to optimize their procurement strategies. Companies can also schedule their operations according to the low-price zones. In a nutshell, it will enable users to make informed energy trading decisions.
Analytics Problem Statement: • To predict hourly electricity load for Alberta Canada • To forecast hourly electricity price based on above predicted load
1. Feature Space
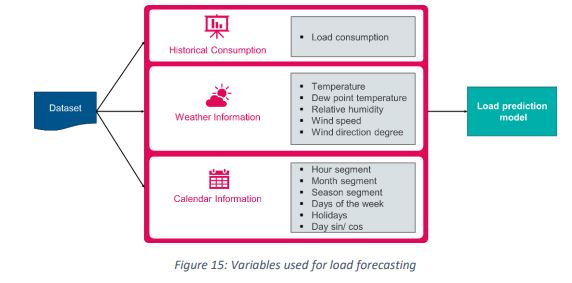
Forecasting energy prices is a function of load prediction. Various parameters like historical load, climate data, and calendar information were considered for forecasting load at an hourly interval of time and in succession load, and other variables were considered to forecast price for the day-ahead market in Alberta Canada.
2. Modeling Approach
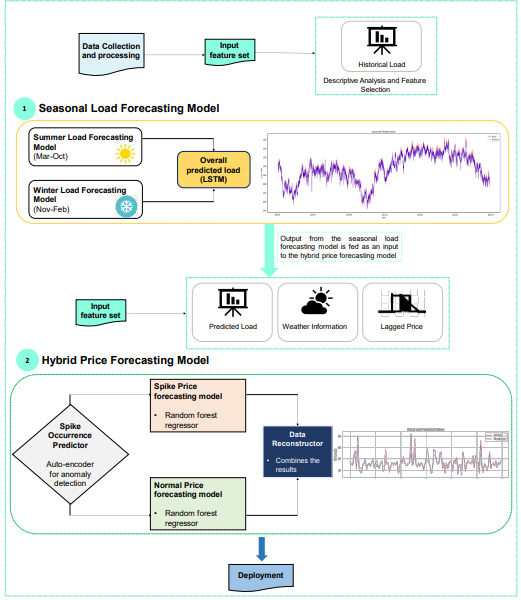
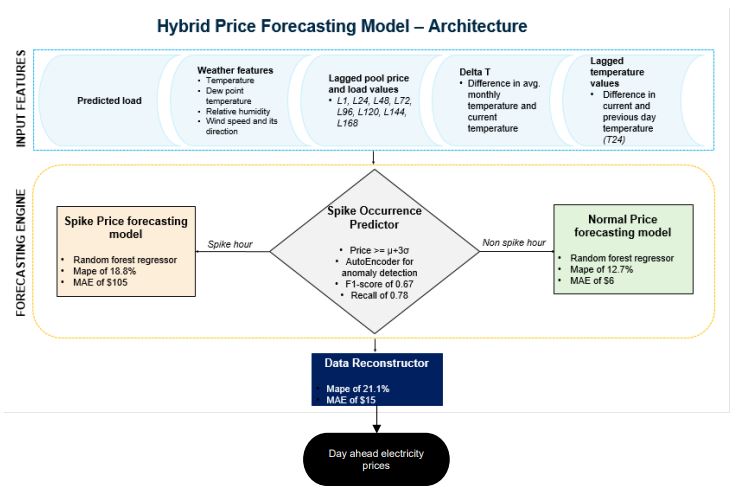
The overall modeling framework adopted for this study can be summarized in the below infographic.
3. Data Preparation
• Missing values - for weather parameters were imputed using MICE. Also, certain parameters like visibility, humidity, wind chill, and station pressure that had over 75% data missing - were removed.
• Upscaling of weather data - it was required to upscale the data from lower to the broader level i.e., from station level to the province level. k-means clustering was used to perform data upscaling to establish data scale uniformity
4. Mechanics of Electricity Pricing
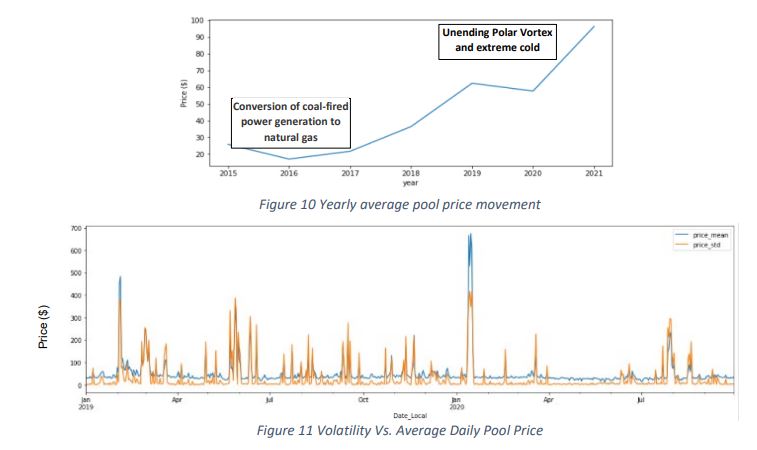
• High volatility in pool prices - Electricity prices in Alberta have been increasing over the years. 2021 has witnessed an
unprecedented surge in electricity prices because of a seemingly unending polar vortex, the
continuing shift from coal- to natural gas-fired power, as well as record-breaking electricity demand
(PPA). Additionally, the tight supply cushion within the Albertan electricity market has caused extreme
volatility on the wholesale market, with the flat pool price averaging at $96/MWh with variability of
$142/MWh (i.e., 1.5 times the average pool price)
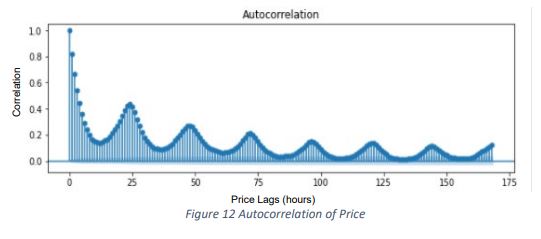
 • Relationship of price with its lagged values - It was observed a strong positive autocorrelation (0.8) of price (t) with its lag (t-1). The chosen lags
i.e., t-1, t-24, t-48, t-72, t-96, t-120, t-144, and t-168 are also coherent with the literature on price
forecasting.
• Relationship of price with its lagged values - It was observed a strong positive autocorrelation (0.8) of price (t) with its lag (t-1). The chosen lags
i.e., t-1, t-24, t-48, t-72, t-96, t-120, t-144, and t-168 are also coherent with the literature on price
forecasting.
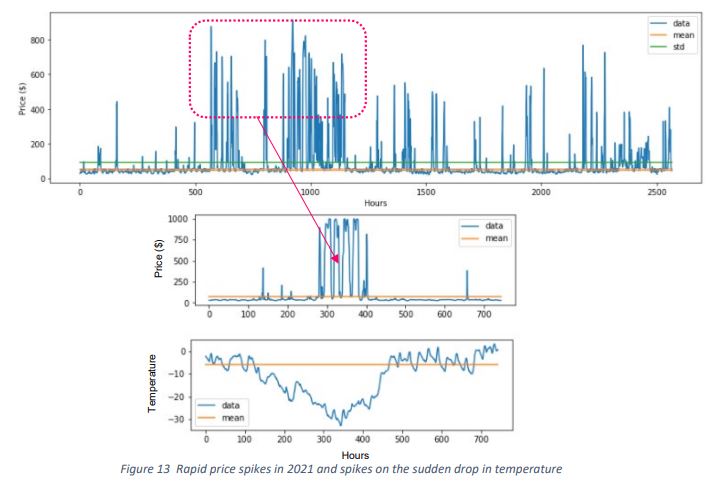
 • Price Spikes - Another characteristic of the Power Pool is price spikes. Shocks in demand and supply, the prevalence
of Polar Vortex resulting in sudden extreme temperatures, and unplanned outages along transmission
lines result in highly volatile prices in certain periods.
For example, temperature between -20 and -30˚C on February 9th, 2021, led to a 61% increase in
prices compared to last year, averaging $254.25/MWh.
• Price Spikes - Another characteristic of the Power Pool is price spikes. Shocks in demand and supply, the prevalence
of Polar Vortex resulting in sudden extreme temperatures, and unplanned outages along transmission
lines result in highly volatile prices in certain periods.
For example, temperature between -20 and -30˚C on February 9th, 2021, led to a 61% increase in
prices compared to last year, averaging $254.25/MWh.
4. Feature Engineering
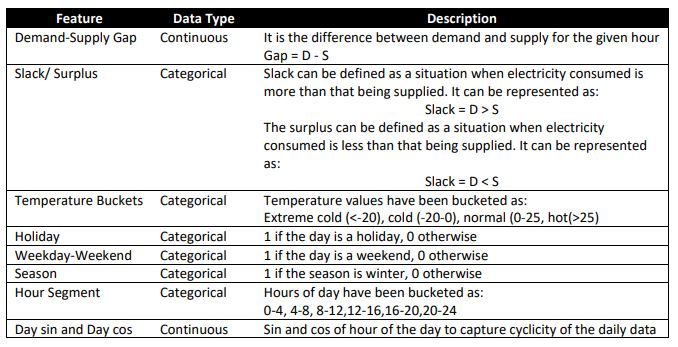
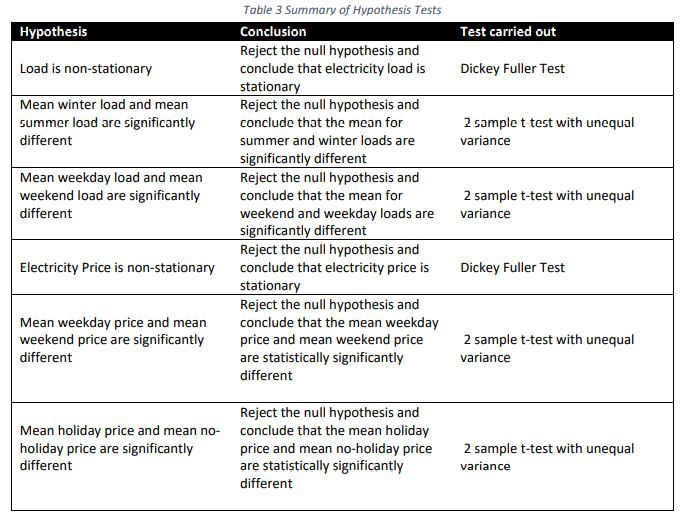
5. Hypothesis Testing
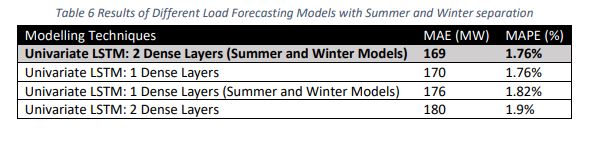
6. Model Building and Validation
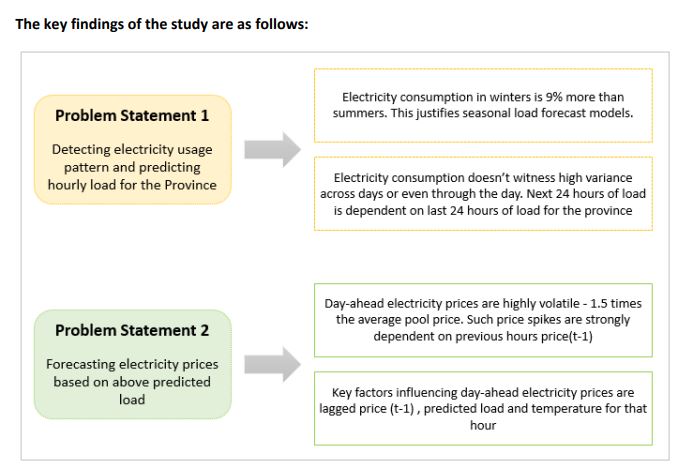
• Seasonal Load Forecasting Model using LSTM - Since load data exhibited significant variance across seasons, two load forecasting models were created using the following features
• Hybrid Price Forecasting Model using LSTM - Price spikes are a critical element in day-ahead electricity price forecasting. While spike hours are not
frequent (2.2% of total hours correspond to price spikes), but their quantum is huge, with the average
price during a spike hour being 21 times more than that of a non-spike hour. Therefore, it was
imperative to build a model that can predict a spike occurrence along with forecasting the price for
that particular hour.
Spike definition - Formally, let µ be the mean of pool price, and σ be the standard deviation of the selected data set.
The threshold level of the sample set can be calculated as:
PTH = µ + 3σ
Where PTH is the threshold value of the selected data set. Any price value greater than or equal to
PTH (Price ≥ PTH) is considered to be a price spike.
7. Conclusion & Recommendations for Further Improvements
Day-ahead electricity prices in Alberta are not just highly volatile in nature but have also turned out to be disruptive given an unending Polar Vortex and extreme cold. This has led to rapid price spikes in 2021 with ~2 times the average pool price. It is a challenging task to forecast prices in such market dynamics with multiple factors at play. It becomes imperative to identify the right set of variables and establish an existential relationship between independent and dependent variables.
Recommendations for Further Improvements The following specific actions were recommended to be taken by the company in preparation for model deployment:
- It is highly recommended to purchase forecasted weather data (temperature, dew point temperature, relative humidity, wind speed, and wind speed direction) from a reliable source to be able to deploy the Hybrid Price Forecasting Model
- Due to highly disruptive price data in 2021, it is suggested to continuously train the Hybrid Price Forecasting Model with the new dataset and re-calibrate spike thresholds, if needed.
- It isstrongly recommended to explore Seasonal, on-peak, and off-peak Hybrid Price Forecast Model to capture price spikes better.
- It is also suggested to build an Intelligent Energy Algorithm to make informed trading decisions, that takes forecasted load and price as input from their respective models and provides an optimized, cost-effective trading decision to buy, sell or generate electricity.
- Integration of Database with time Series-based visualization tools.